
AI Augmented Commodity Price Forecasting - Part 1
Updated:
Introduction
Commodity price forecasting plays a critical role in the strategic plan of procurement and pricing of products that rely on these commodities as raw materials. Forecasting empowers planners to make data-driven decisions, reduce pricing-related risks, and proactively manage suppliers while minimizing disruption in the supply chain because of price volatility. For manufacturing heavy companies, raw material bulk procurement can be upwards of 50% of the cost of running the entire business. Hence, the need for accurate price forecasting for firms to make more informed pricing decisions has become more critical.
Why Raw Material Price Forecasting?
Forecasting raw material prices has several advantages. Some of the areas where it is critical for planning and production in today’s modern manufacturing landscape are:
- Procuring raw materials: With no prior information on future order volume, industries often purchase raw materials without full knowledge to ensure that their factory can produce the goods as soon as the order is placed. Hence, in these scenarios, price forecasting becomes helpful in procuring the required raw material when the prices are low.
- Sensing future demand: For a few manufacturing industries, demand is highly tied to raw material prices, which helps anticipate future demand.
- Pricing of finished goods: Anticipation of raw material prices is a key to product pricing and market competitiveness. For semi-finished goods industries, the final product price is usually some factor of raw material price.
- Production planning: Better production planning comes from better demand sensing, which depends on raw material price forecasting.
- Managing inventory: An opportunity to buy raw material at a lower price should always be balanced with the existing inventory.
Traditional Price Forecasting Mechanism
Many businesses rely either on analyses from business experts or on statistical models. Some of the ways business generates manual forecasts are:
- Market Reports: Reputed vendors such as IHS Market, S&P Global, ICIS, CRU, Argus, Baltic exchange, etc.
- Brokers: Manual data collection, often by calling brokers or communicating via WhatsApp, etc.
- News Reports: Unstructured news from news agencies, ad-hoc news sharing via WhatsApp, etc.
- News Aggregators: Bloomberg, Google, etc.
- Vendor Sensing: Sensing through discussions with vendors to sense if the price is moving up or down according to the vendor.
- Experience: Experience-based (SME) forecast by looking at port stocks, operational capacities of plants, oil prices, etc.
Companies make educated guesses on what the future holds based on the expert’s expertise and previous decisions with the ways mentioned above. Unfortunately, the traditional (manual) forecasting mechanism sometimes fails to provide a reasonable forecast because of the high volatility and complexity generally associated with commodity prices. Hence, there is a need for an alternate price forecast that could augment the manual forecast and help businesses make more informed pricing decisions.
Need for AI based Forecasting
The traditional forecast methods are either based on quantitative and qualitative analysis of supply and demand-side indicators or statistical models using univariate approaches relying exclusively on historical price data. However, these methods fail to capture market dynamics and do not perform well for a more extended forecast (weekly/monthly). Whereas AI/ML-based forecasting models can provide more accurate forecasts even for longer time horizons. These algorithms can also process a large amount of historical data and find hidden patterns to help companies make better decisions. Some of the benefits of AI-based forecasting are:
- Capable of dealing with high price volatility
- Capable of integrating multiple predictors from heterogeneous sources
- Capable of providing an accurate forecast for longer time horizons
- Model Interpretability or understanding an impact of a variable
Different Types of Forecasting – Time Horizons
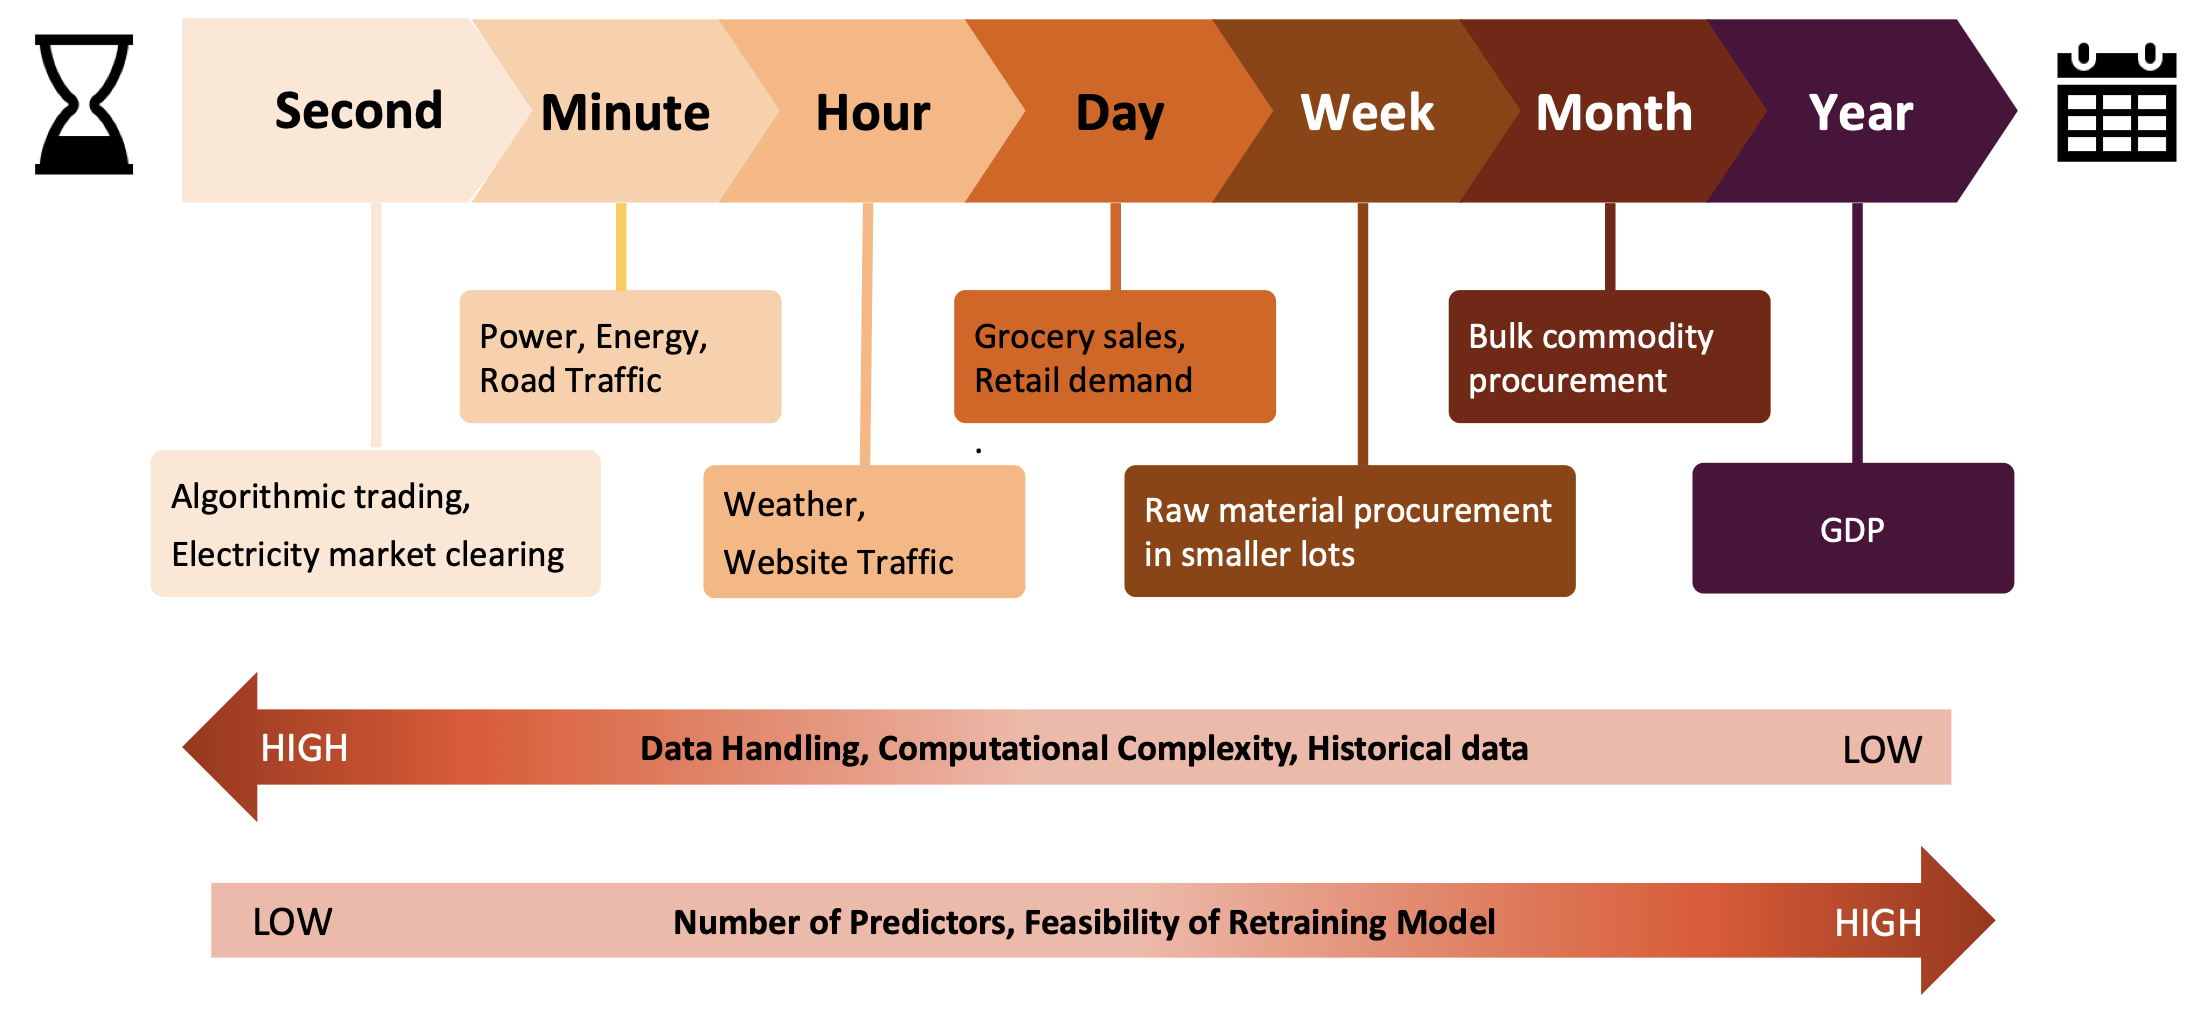
The above figure shows some of the forecasting examples with different time horizons (lookahead) and their challenges. For short-term forecasting, i.e., with time horizon as seconds/minutes/hours, the challenge is to deal with the higher computational complexity arising from the large historical data. Whereas, as we move to the right for a longer time horizon (>= week), which is usually the case with commodity prices, the challenge is to deal with less historical data and a large number of predictors as its easier to collect more indicators on a weekly and monthly basis. This results in a short time series problem with p > > N (no. of predictors > observations), which in turn requires a careful selection of algorithm to provide a reasonably accurate forecast. However, due to the challenges mentioned above with AI-based forecasting for a longer time horizon, the AI-based forecasts cannot completely replace the existing manual forecast and are more suited for augmenting the manual forecast.
Data Collection
Fundamental analysis is the process of collecting supply and demand data and is an essential exercise for commodity price forecasting. It helps us understand whether a market is in deficit, equilibrium, or oversupply. In addition to supply and demand, other exogenous factors like political events, sudden imposition of a tariff on imports and exports by a government, sudden changes to currency can also change supply and demand characteristics. The major challenge in commodity price forecasting is finding the right and updated data sources describing the market and its participants and understanding how these factors dynamically change the models. Some examples of supply, demand, and exogenous factors and the source’s information are listed below, with an example of a predictor map.
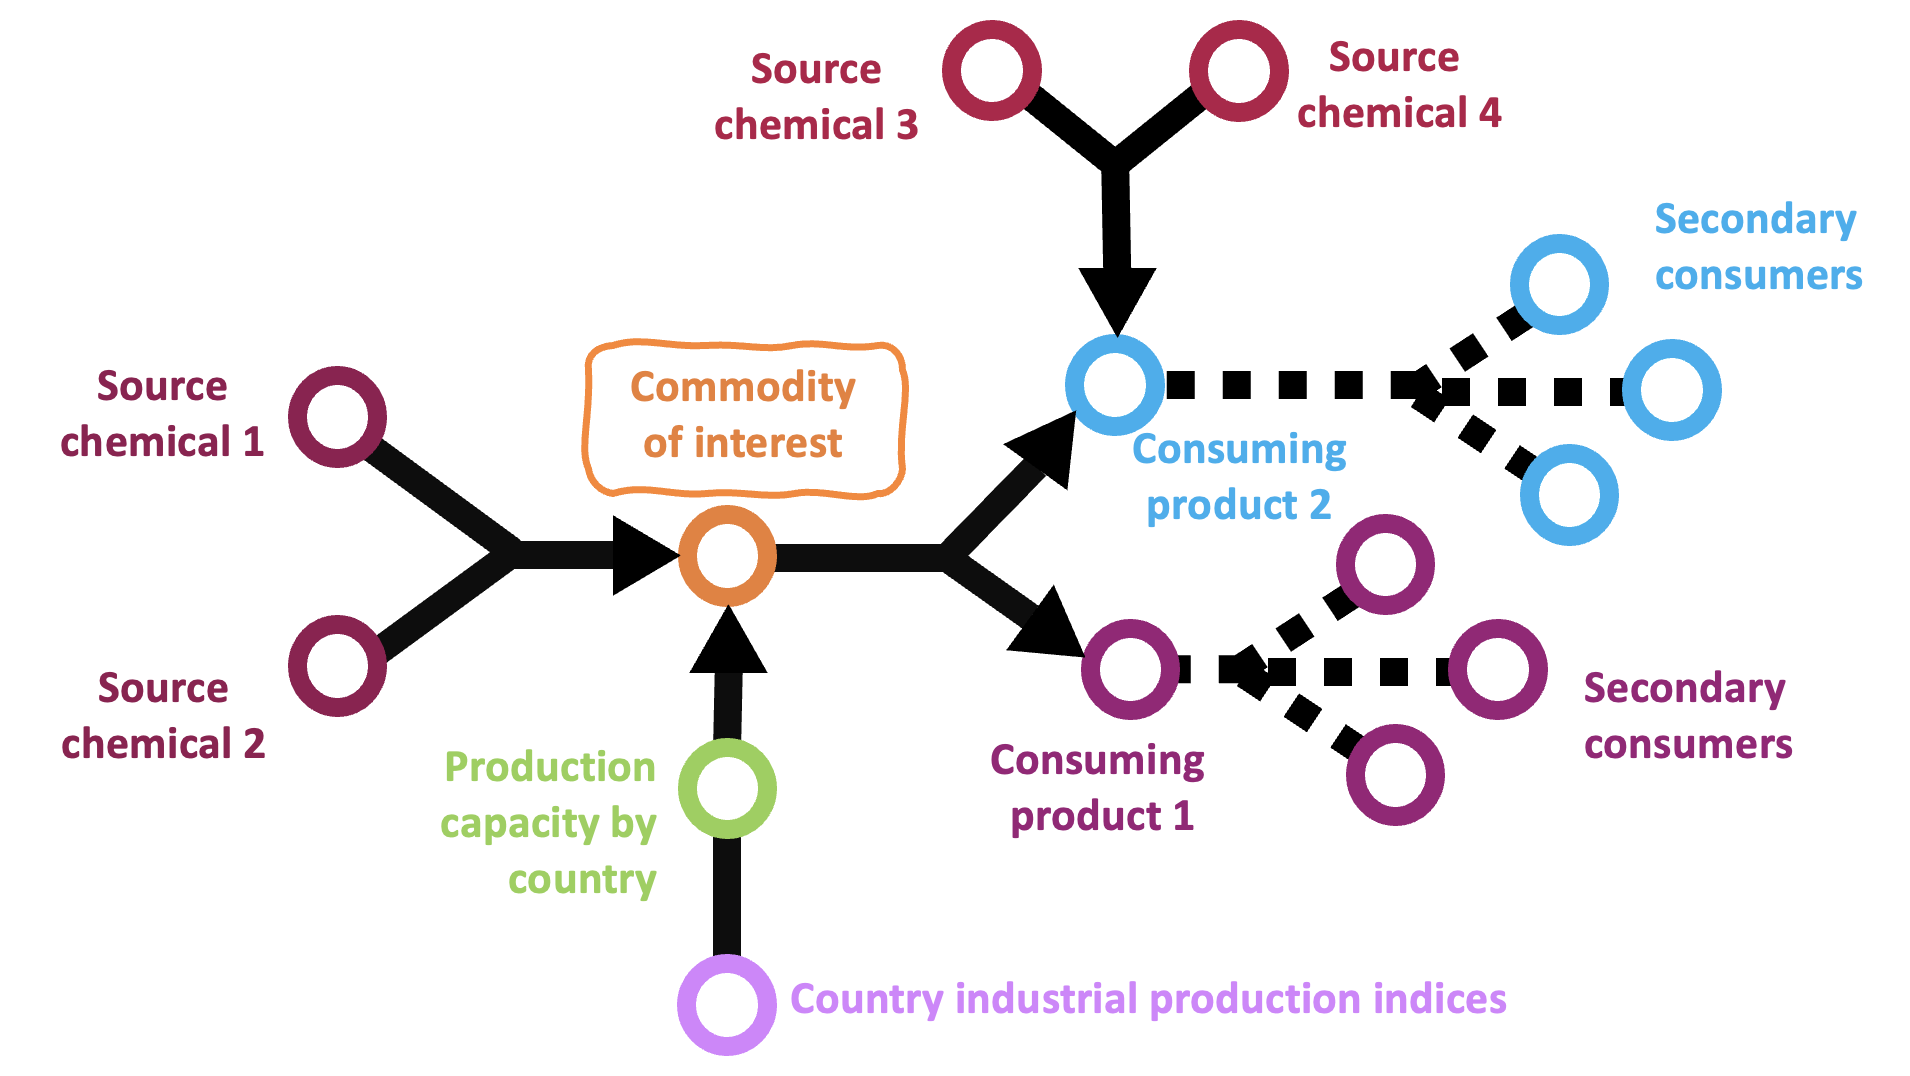
1) The Supply Side: In general, the supply side of a commodity forecasting problem needs to consider the following indicators: • Price of raw materials used to manufacture the commodity • Import, export data from different countries dealing with said commodity • Level of stockpiles or inventories held in the storage of the commodity • Global operating capacity for the plants manufacturing the commodity
2) The Demand Side: Commodity demand is ubiquitous as the consumption of raw materials occurs worldwide and is highly correlated and impacted by some of the economic factors like currency values, interest rates, and economic growth. For e.g., commodity demand tends to increase when the world economy is healthy and growing, commodity demand tends to increase, and the converse is true during times of economic weakness. Examples of demand-side predictors are listed below: • Product data (price/stock) for products that consume the commodity for value addition • Stock prices of the businesses using the commodity • Prices of alternative product or competitor of the product manufactured using the commodity
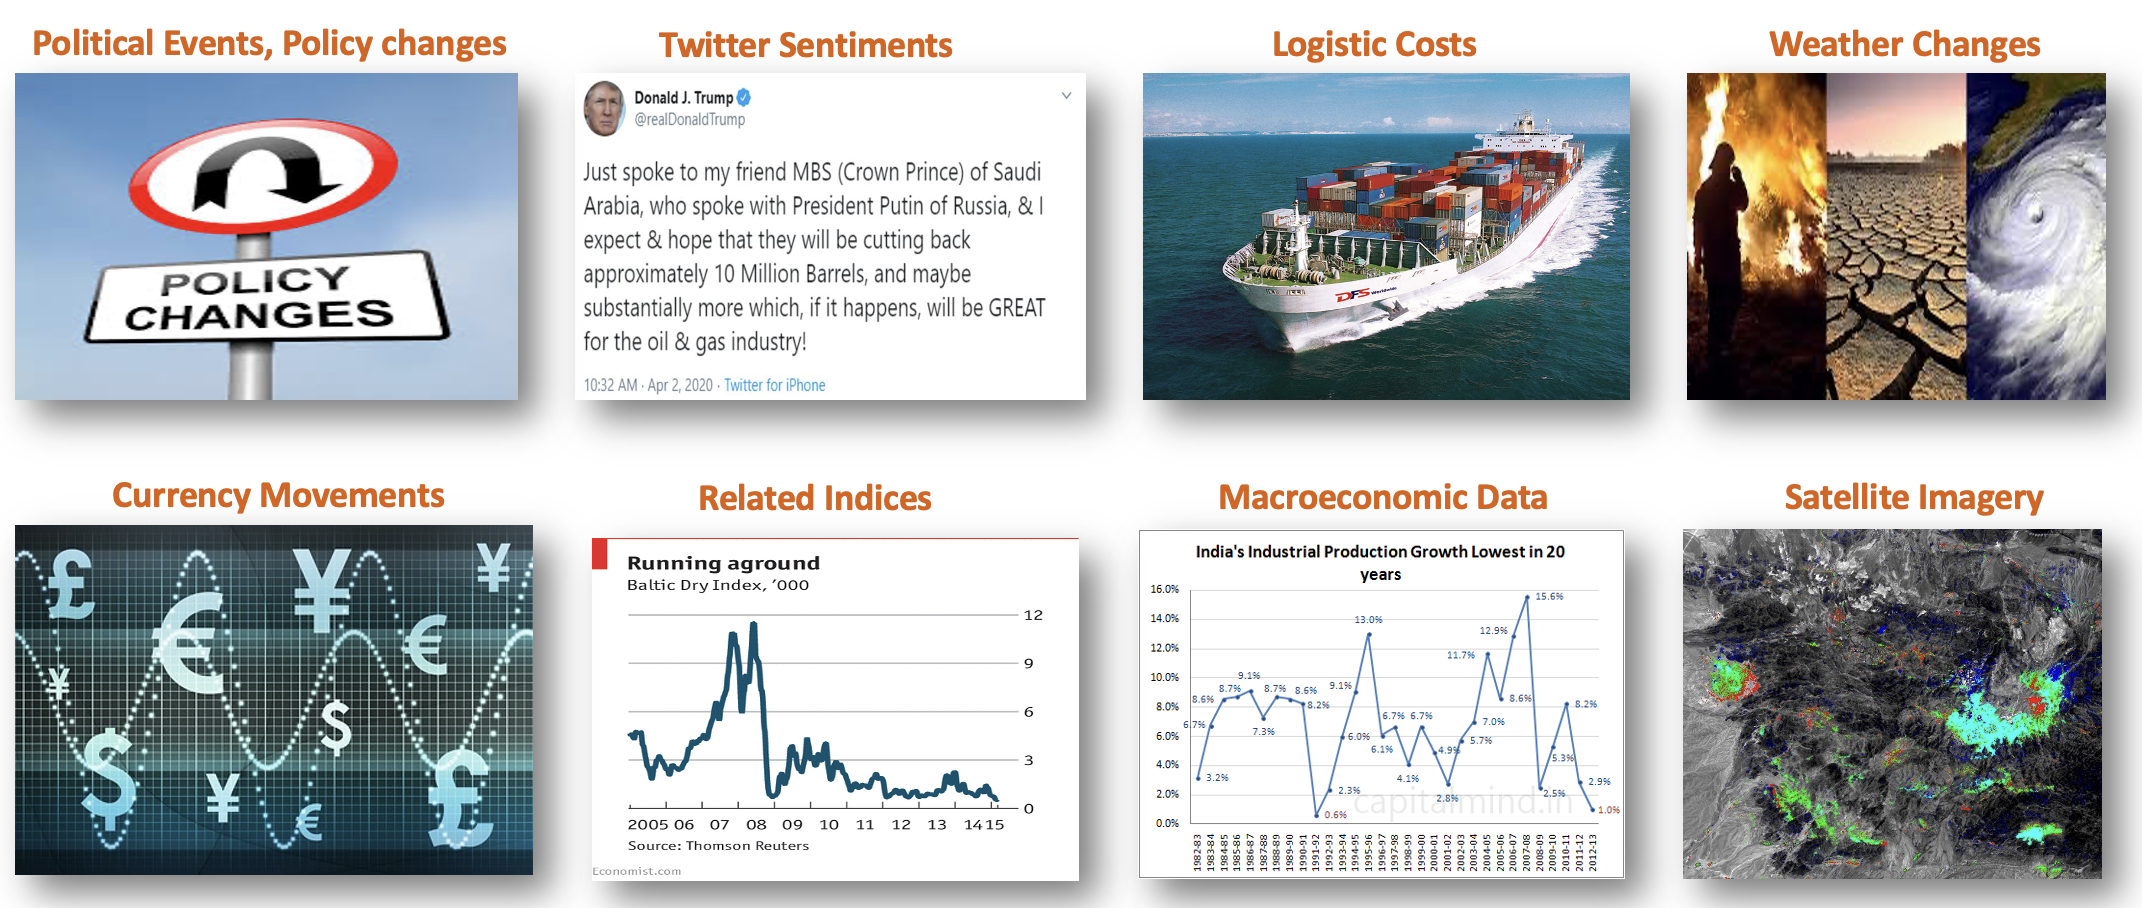
3) Exogenous factors: Some of the examples of exogenous factors are listed below: Indices capturing some of the important political events, tariff imposition, change in policy Trade war data by capturing sentiments through Twitter or any other source Weather data (hurricane) to capture the effect of change in weather for commodity Logistic costs Currency movements Index related (Baltic Dry Index, S&P 500) Macroeconomic (Industrial Production) Satellite imagery (e.g., measures of activity derived from images of open cast mines)
Together with fundamental supply and demand data, these exogenous factors result in the price solution for commodity prices. For most critical commodities, a tremendous amount of data is available from both government and private agencies. Ex. American Petroleum Institute (API), a private enterprise, and the Energy Information Administration (EIA), a US government agency for energy commodities like crude oil, oil products, coal, natural gas, and other energies. Other sources are Argus Media, Bloomberg, Reuters, etc.
Once we have collected all the data, we will build different models to generate forecasts, covered in Part 2 of the topic.